Education Innovation Survey: Oakland
What Oakland Educators Say About Innovation, Burnout, and the System Around Them
.png)
Oakland educators are not short on ideas. They are short on infrastructure.
This survey set out to measure something rarely quantified: how many people inside the education system have ideas for new schools, programs, tools, or learning models - and what happens when they try to act on them.
The findings consistently point in the same direction. The will to innovate is widespread, the pathways to act on it are not.
What follows is a snapshot of where ideas come from, why most of them never get off the ground, and what would change if they could.
At a Glance
- 64% of Oakland educators have had an idea for a new school, program, tool, or app
- 76% have seriously considered leaving education to pursue an idea outside the system
- 64.7% would extend their time in education if given an environment to pilot new ideas
- 83.3% spent their own money on classroom tools, tech, or resources in the past year.
- 90.0% are not part of any organized innovation community.
- 27.3% say there is nowhere locally to go for support.
Oakland Educators Are Generating Ideas
The starting point isn't a shortage of imagination.
64% of Oakland educators have had an idea for a new school, program, tool, or app at some point in their career.
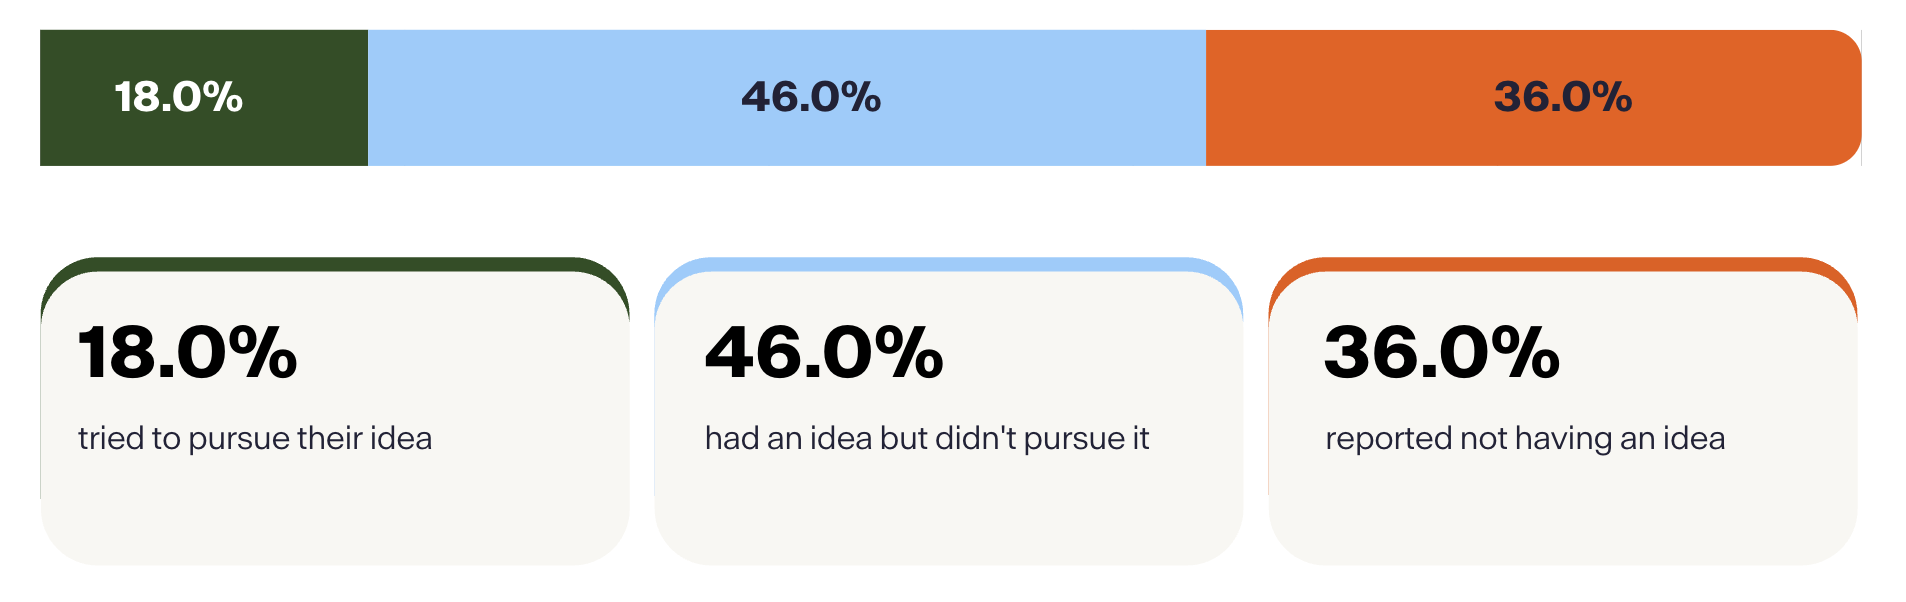
Most never act on it.
- 18.0% tried to pursue their idea
- 46.0% had an idea but didn't pursue it
- 36.0% reported not having an idea
The same pull shows up in retention behavior.
76% of educators have seriously considered leaving education to pursue an idea outside the system - 16.7% have left or plan to leave, 59.4% considered it but decided to stay, and 24.0% have not considered leaving.
In 4.0's March 2026 national survey of 1,000 educators, the equivalent figure was 62.3% - placing Oakland 13.7 points above the national average.
When asked what they would do with five extra hours and resources, educators didn't reach for solo invention - they reached outward.
The top responses were building partnerships with local businesses or mentors (25.3%), shadowing other innovative schools or classrooms (25.0%), and designing new interdisciplinary curriculum (22.3%).
Drafting a formal proposal for a new school model came in fourth (18.0%), with prototyping a new student-facing app or tool at 8.0%.
More than half - 50.3% combined - would use found time to connect outward rather than build alone.
The pattern suggests educators are looking for connective tissue more than they are looking to invent in isolation.
Structural Barriers Stop Ideas Early
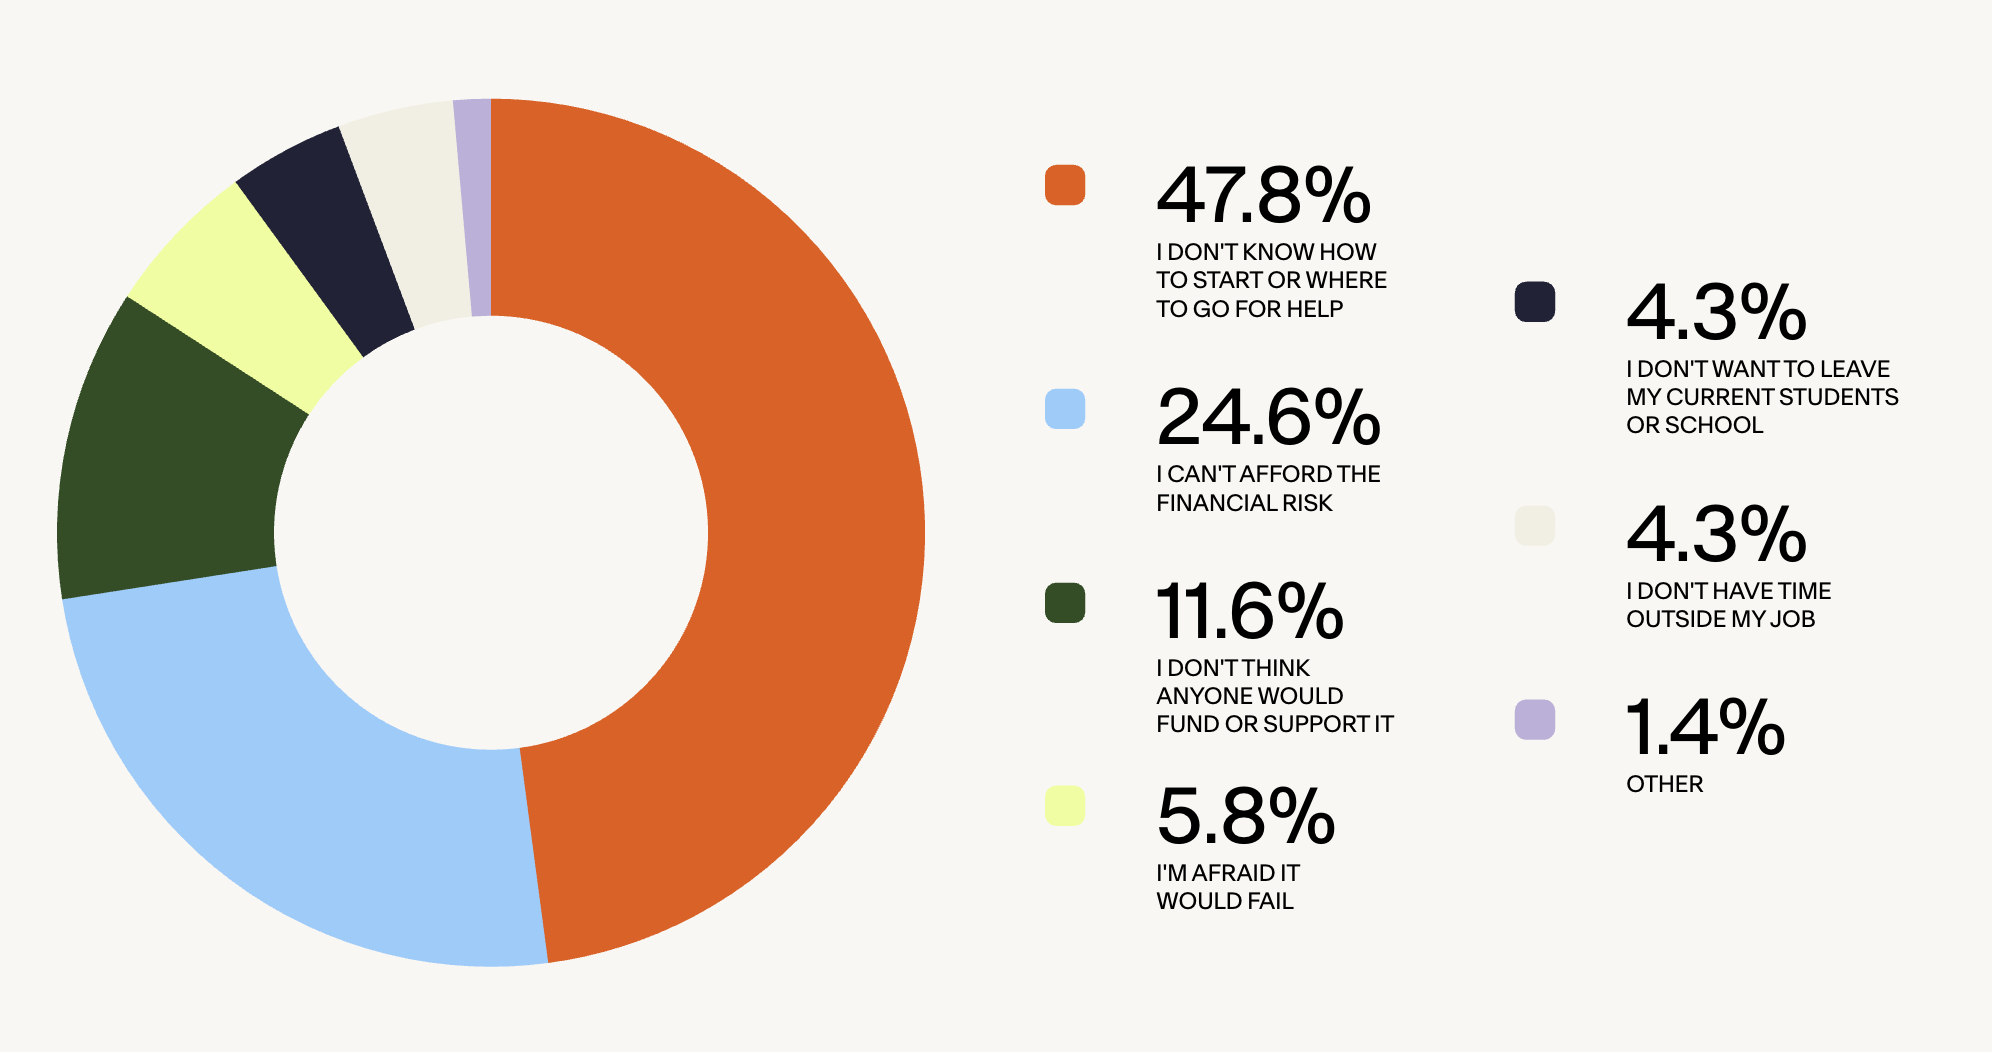
For educators who had an idea but didn't pursue it, the barriers reported were informational and financial, not personal.
- 47.8% said: "I don't know how to start or where to go for help"
- 24.6% said: "I can't afford the financial risk"
- 11.6% said: "I don't think anyone would fund or support it"
- 5.8% said: "I'm afraid it would fail"
- 4.3% said: "I don't want to leave my current students or school"
- 4.3% said: "I don't have time outside my job"
- 1.4% other
The top three reasons - all structural in nature - together account for 84% of why ideas stall. Only 5.8% of educators cite fear of failure.
In the same 4.0 national survey, 32.1% of educators named "I don't know how to start" as the reason they hadn't pursued an idea, putting Oakland's pathway barrier 15.7 points above the national average.
Asked at the city level to identify the single biggest barrier preventing them from successfully launching new educational ideas, the breakdown reinforces the diagnosis:
- 23.3% funding - lack of local investors, grants, or philanthropists
- 18.0% time - workload leaves zero margin for design
- 16.0% network - not knowing the right people
- 16.0% information - lack of "how-to" pathways for this specific city
- 12.7% permission - too many approval layers
- 10.7% safety - risk to job or reputation if a pilot fails
- 3.3% other
Capacity-related barriers - funding, time, network, and information - account for 73.3% of responses.
Cultural and political barriers (permission and safety) account for less than a quarter.
Read together, the data suggests the most immediate opportunity is not simply to inspire more ideas, but to build the conditions that allow existing ideas to move: clearer pathways, accessible capital, and stronger connections.
Decision-Making Feels Distant from Classroom Reality

Asked who has the most influence over whether a new idea actually reaches students, educators' answers concentrate at the top:
- 30.7% the District Superintendent / Central Office
- 21.3% the Local School Board
- 19.3% state-level legislators
- 10.0% the Teachers' Union
- 7.3% parents and community advocacy groups
- 6.0% individual school principals
- 2.0% local philanthropic foundations or donors
- 3.3% other
Official top-down channels - superintendent, board, state, and principals - account for 77.3% of perceived influence.
Grassroots actors (parents and philanthropy) sit under 10% combined.
And those decision-makers feel far away. Only 10.0% of educators describe local decision-makers as "close - they visit often and understand the daily struggle."
49.3% say "distanced - they mean well but are out of touch." 40.7% say "disconnected - they live in a different reality entirely."
When asked what phrase they hear most often at work, the responses cluster around constraint:
- 52.0% "We don't have the budget/funding for that."
- 20.7% "We need to wait for District approval first."
- 13.3% "We've always done it this way."
- 8.0% "That's not going to be on the state test."
- 0.7% "That sounds too chaotic/unstructured."
- 5.3% other
Nearly 95% selected a workplace phrase associated with constraint - budget, approval, tradition, testing, or structure.
Taken together with the influence data, the picture is one of decision-making concentrated upward and experienced from below as remote.
The Local Innovation Ecosystem Is Fragmented

Educators don't describe a connected community around them.
- 10.0% "I am part of a thriving, connected group of local changemakers"
- 42.7% "I know a few other educators, but we are not organized"
- 14.0% "I feel like I am working in a total vacuum"
- 33.3% "I didn't know there was a community for this in my city"
90% of educators are not part of any organized innovation community. One-third didn't know such a community could exist in their city.
Asked where they would actually go locally for collaborators or support, 28.7% point to their own personal network and 27.3% say "nowhere - I don't believe there is a local place that supports grassroots education ideas."
22.7% would turn to a local university or research hub. 20.0% would turn to a specific local incubator or non-profit.
Industry ties tell a similar story. Asked to describe the connection between industries and their school or organization:
- 13.3% integrated - active, ongoing partnerships with local companies
- 35.3% transactional - occasional donations or one-off guest speakers
- 40.0% invisible - no clear bridge between industry and classrooms
- 11.3% gatekept - partnerships exist but managed at district level
86.7% of educators describe the industry–education connection as transactional, invisible, or gatekept.
Only 13.3% report meaningful integration.
At the same time, educators see significant untapped assets in the city.
Asked what is the most under-leveraged asset in Oakland, the top answers were community-based organizations and non-profits (27.3%), local universities and research institutions (22.7%), the city's arts, music, and cultural scene (16.0%), local industry and corporate headquarters (14.0%), and a strong spirit of local resilience and grassroots activism (10.0%).
Half of respondents point to non-profits and universities as the biggest under-leveraged assets - the same institutions that could form connective infrastructure if mobilized.
The Cost Shows Up in Burnout, Spending, and Risk Aversion
Asked what education issue local leaders are avoiding the most, educators name burnout first - by a wide margin.
- 38.0% mental health and burnout of innovative educators
- 19.3% widening gap between high- and low-performing local schools
- 16.7% student readiness for the local job market
- 14.7% AI completely replacing traditional testing
- 10.0% need for radically different school models (microschools, pods)
- 1.3% other
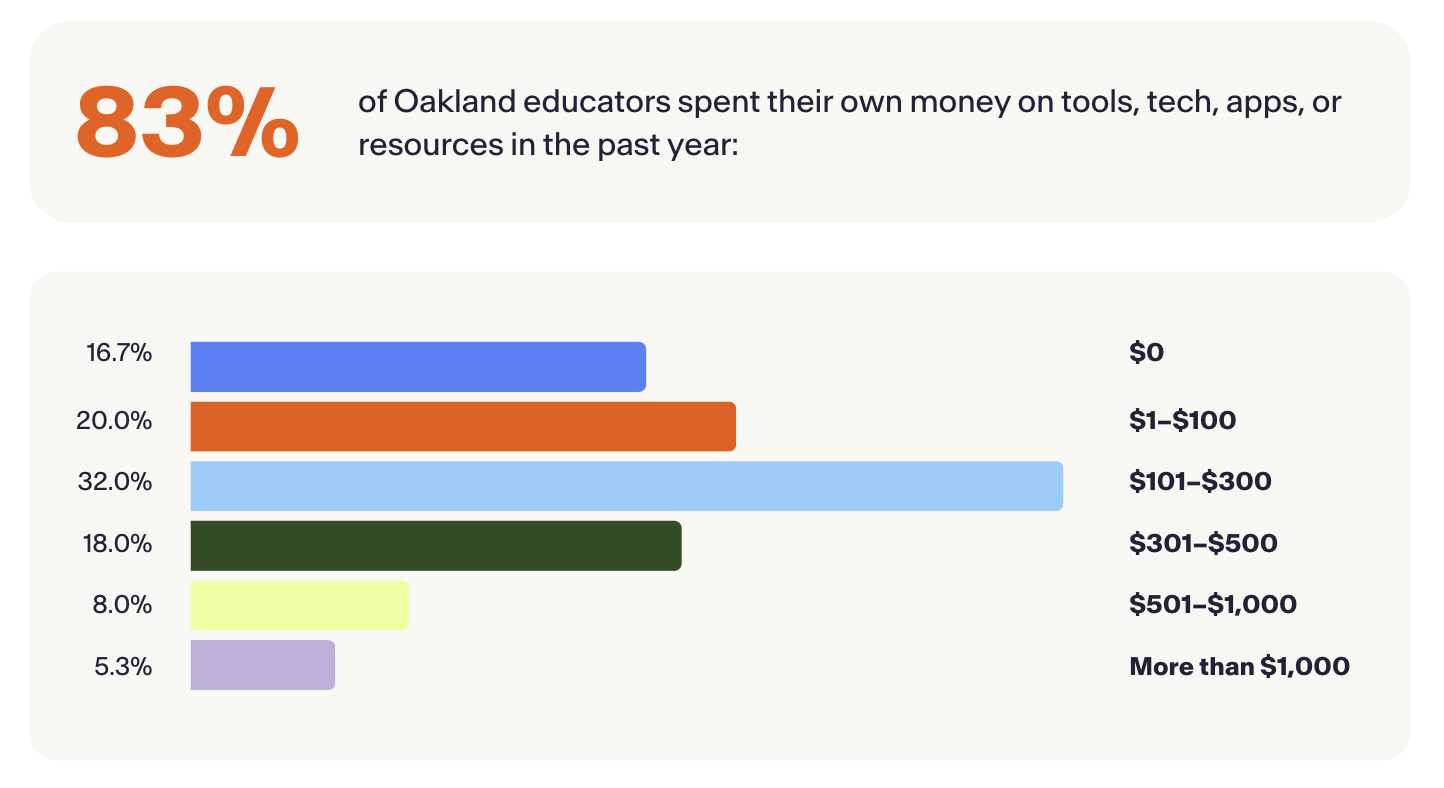
In the meantime, educators are subsidizing the system out of pocket. 83% of Oakland educators spent their own money on tools, tech, apps, or resources in the past year:
And when educators do experiments, they do so carefully. Asked to describe the psychological safety they have to try things and fail at school:
- 5.3% "No safety - mistakes are documented or punished"
- 28.7% "Very little - I only try things I know will work"
- 50.7% "Moderate - I can experiment if my scores stay high"
- 10.7% "High - my leadership encourages failing forward"
- 4.7% "Total freedom - innovation is expected, even if it fails"
84.7% of educators operate with moderate or less psychological safety to fail. Only 15.3% have leadership that actively encourages risk-taking.
Asked for the single word that best describes innovation in their city:
- 37.3% stagnant - the system is actively resisting new ideas
- 24.7% exhausted - people want to innovate but have no energy left
- 21.3% emergent - small pockets of greatness are starting to connect
- 8.7% restless - we are ready for change but feel stuck
- 8.0% optimistic - we are the next great hub for education design
62% chose "stagnant" or "exhausted." Only 8% chose "optimistic."
The climate descriptor is itself part of the cost, educators describe a system where the energy to build something new is in short supply.
Freedom to Pilot Is a Retention Strategy
If educators were to leave their current school in the next two years, the reason would be:
- 38.7% burnout - workload and red tape no longer sustainable
- 26.0% financial - need a higher salary
- 15.3% toxic culture - unsupportive leadership or environment
- 10.0% pursuit of an idea - to launch outside the system
- 5.3% lack of autonomy - no freedom to innovate
- 4.7% other (predominantly retirement)
System-related drivers - burnout, toxic culture, lack of autonomy - account for 59.3% of attrition reasons. That is more than double the financial driver (26.0%).
The flip side is the lever. Asked how their plans would change if they were guaranteed an environment where they could freely pilot new ideas:
- 32.7% "I would stay significantly longer than currently planned"
- 32.0% "I would stay a few years longer"
- 32.7% "It wouldn't change my current timeline"
- 2.7% "I am already planning to leave regardless"
64.7% of Oakland educators would extend their time in education if given freedom to pilot.
The implication is direct: a structured pathway to experiment functions not only as an innovation strategy but as a retention one, addressing the same root cause - burnout and red tape - that drives most attrition.
What This Means
Oakland's education workforce is full of ideas. The barriers to acting on them are not personal - they are pathways, capital, networks, and permission. The decision-making layer feels remote. The community layer is thin. The cost is being absorbed by educators themselves, in cash and in attrition.
The same data points to the intervention.
Educators want to connect outward, not build alone. They name non-profits and universities as the most under-leveraged assets in the city - the exact institutions that could form a connective ecosystem if mobilized.
And nearly two-thirds say they would stay in education longer if given a structured way to pilot.
.png)
.png)
.png)
.png)
Be part of the community